In my elearning career I have seen two ed technologies appear that have transformed learning* in my particular areas of interest (web based video and interactive web maps). On Friday, I saw a third: True AI marking via the Gallito tool which was presented by some colleagues from UNED, a Spanish university.
How it works: If you set up an open self assessment question in a course, you can define what the student should answer in terms of topics they should cover. This is then fed into a model which is transferred into an algorithm. Any answer the students give is analysed by the algorithm, it breaks down the text into grammar and then compares this to the answer it has. It gives the students a graph showing how they scored against various criteria. I had lots of questions for the presenters about how this actually works technically, unfortunately the programmers weren’t there to help their education colleagues so I didn’t get very far in understanding it. What they did make clear was that this isn’t a ‘black box’, they haven’t fed in a load of answers to the same questions with a tutors marks and used that to train a marking tool, the algorithm is designed from the ground up.
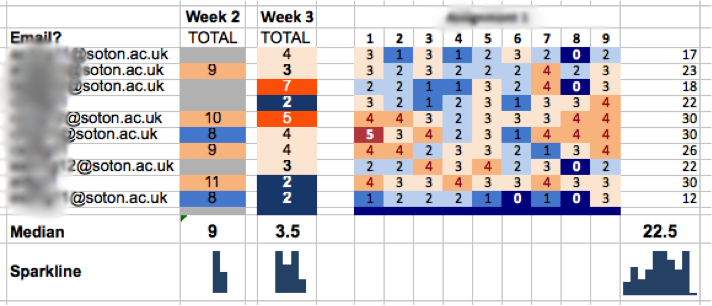
Testing it: The presenters then went on to show various ways they’ve tested this. UNED (the parent university) is a distance learning university in Spain that is publically funded, they put the algorithm to work assessing students formative work on a business course. Students could try a self assessment question and get immediate feedback: a mark and a graphical representation of where they’re answer was good or bad with respect to the marking criteria was given. Students liked the feedback and were prepared to answer the same question multiple times in order to improve their marks and to develop their understanding. UNED also used the tool to mark pre-exisiting assignments, they found that the tool marked close to the average of a group of makers who also marked the assignments. The human markers on the module varied between them, the tool was marking higher than the hard markers and lower than high markers (on average).
Applications: My description above has been fairly sketchy because it was a quick presentation. However, I believe that they’ve achieved a tool that can semantically break down a student answer and give pretty reasonable feedback. What is immediately obvious is that this is fantastic for formative marking: students building up to an assignment can practice their writing over and over before they attempt the actual assignment without having to involve a tutor at all. That could be a game changer for MOOCs who currently have to rely on multiple choice questions that are poor tools to test high level understanding.
Of course if Gallito does do what is claimed for it, it could also be used to mark students assignments. This area is much more contensious with lots of potential issues brewing. I suspect it will affect this area at some point in the future, just not for now.
Trialling it at the Open University: Along with a colleague, I’m very interested in seeing what the tool can do close up so we’re pushing to get a programme together to investigate it. Our colleagues at UNED are keen we do this.
The rise and rise of AI: I’ve read in the news about AI taking over all kinds of work. I didn’t think it would appear in teaching for a long while, years or even decades. However, it seems its here already. Is this is a disruptive technology that utterly changes education as we know it? I just don’t know. However, I am sure that if the tool proves itself it will be very significant.
*IMHO of course, you may have a different list.
 Over the last few days I’ve been playing around with