March 2020 – January 2021
“Just an overall comment that these [story maps] look beautiful, are very clearly explained and is clearly a tremendous amount of work; I’m really impressed.”
Quote from a reviewer of the project (member of the public) at the December workshop.
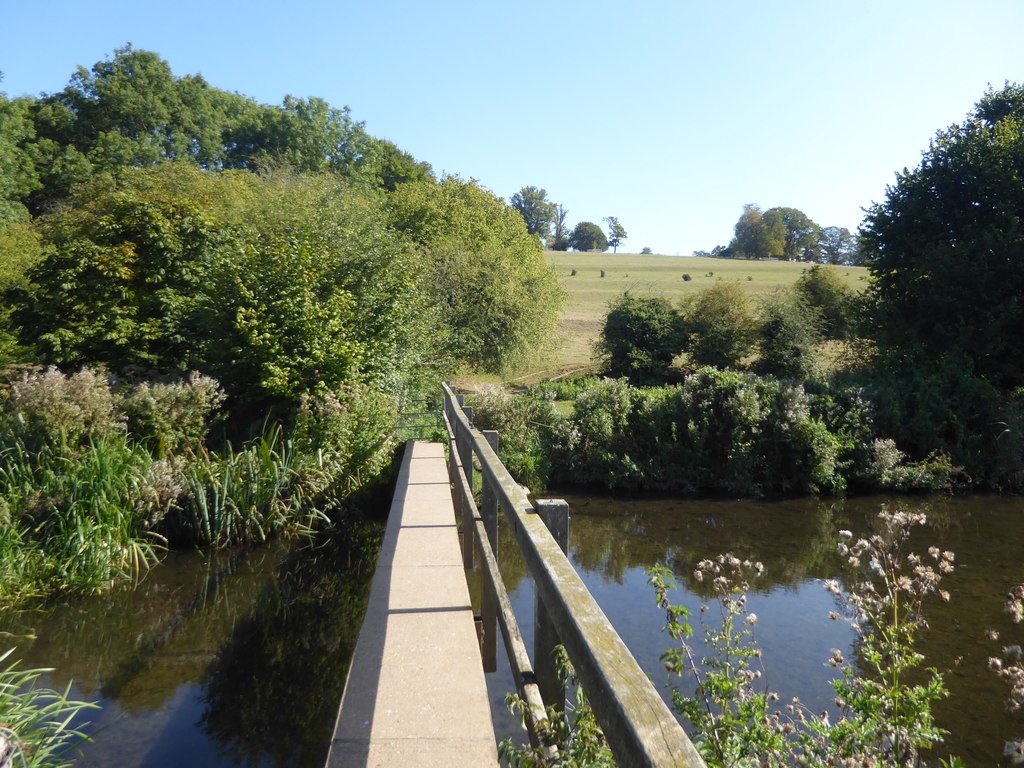
As part of an outreach project to educate the public about the Chess River with colleagues in the School of Geography, at Queen Mary’s University London (QMUL) and UCL, I have created a collection of StoryMaps. It involved liasing with stakeholders (Environment Agency, Water companies, local environmental NGOs, Esri) and production of a number of maps, graphics and videos.
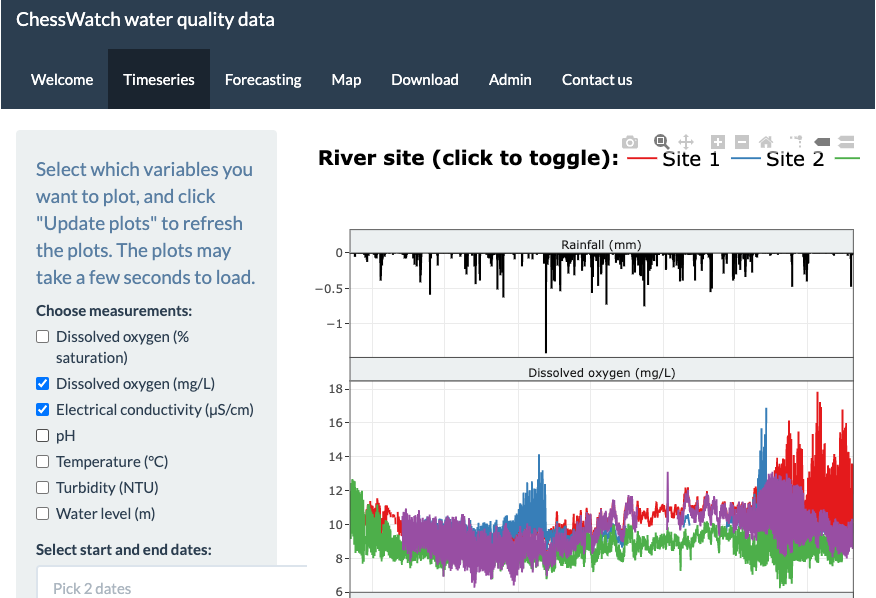
The idea of the ‘observatory’ is that we provide near real-time data dashboards of the river status:
- The water quantity dashboard shows the river flow rate over time and uses publically provided data.
- The water quality dashboard – shows changes in water chemistry over time and uses data from sondes placed in the river by another QMUL project.
To explain what is happening in the dashboards, we provide a series of StoryMaps (1 to 3) which explain the environment and science behind the behaviour of the river.
Other work on the project
The cartography, animation effects and static graphics are produced by me. Other technical tasks have been:
- Running an ArcGIS hub,
- Producing a ‘collection‘ of story maps
- Setting up user surveys in Survey123
- Setting up Google Analytics.
- Analysing Google Analytics
I discuss the use of StoryMaps further in a blogpost outlining the excellent features it has for telling spatial stories.
Project Team
QMUL: Prof Kate Heppell, Dr Stuart Grieves
UCL: Muki Haklay, Yaqian Wu
Crick Institute: Hefin Rhys (volunteer)